Gene signature scoring with pyUCell#
In single-cell RNA-seq analysis, gene signature (or “module”) scoring constitutes a simple yet powerful approach to evaluate the strength of biological signals – typically associated to a specific cell type or biological process – in a transcriptome.
pyUCell is a package for evaluating gene signatures in single-cell datasets. pyUCell signature scores, based on the Mann-Whitney U statistic, are robust to dataset size and heterogeneity, and their calculation demands less computing time and memory than other available methods, enabling the processing of large datasets in a few minutes even on machines with limited computing power.
For installation instructions, refer to the README.
Prepare data and signatures#
import scanpy as sc
import matplotlib.pyplot as plt
import pyucell as uc
To run pyUCell, you will need two things: 1. a single-cell data object in AnnData format, and 2. a list of gene signatures.
First, load a test dataset:
adata = sc.datasets.pbmc3k()
Define two simple signatures to test
signatures = {"Tcell": ["CD3D", "CD3E", "CD2"], "Bcell": ["MS4A1", "CD79A", "CD79B"]}
Run pyUCell#
Now we can score these gene signatures using pyUCell:
uc.compute_ucell_scores(adata, signatures=signatures, chunk_size=500)
The results are stored in adata.obs as a matrix of cell-wise scores:
adata.obs
| Tcell_UCell | Bcell_UCell | |
|---|---|---|
| index | ||
| AAACATACAACCAC-1 | 0.599688 | 0.000000 |
| AAACATTGAGCTAC-1 | 0.000000 | 0.856030 |
| AAACATTGATCAGC-1 | 0.902982 | 0.000000 |
| AAACCGTGCTTCCG-1 | 0.191366 | 0.000000 |
| AAACCGTGTATGCG-1 | 0.000000 | 0.000000 |
| ... | ... | ... |
| TTTCGAACTCTCAT-1 | 0.000000 | 0.000000 |
| TTTCTACTGAGGCA-1 | 0.000000 | 0.626391 |
| TTTCTACTTCCTCG-1 | 0.000000 | 0.802403 |
| TTTGCATGAGAGGC-1 | 0.000000 | 0.650645 |
| TTTGCATGCCTCAC-1 | 0.594571 | 0.000000 |
2700 rows × 2 columns
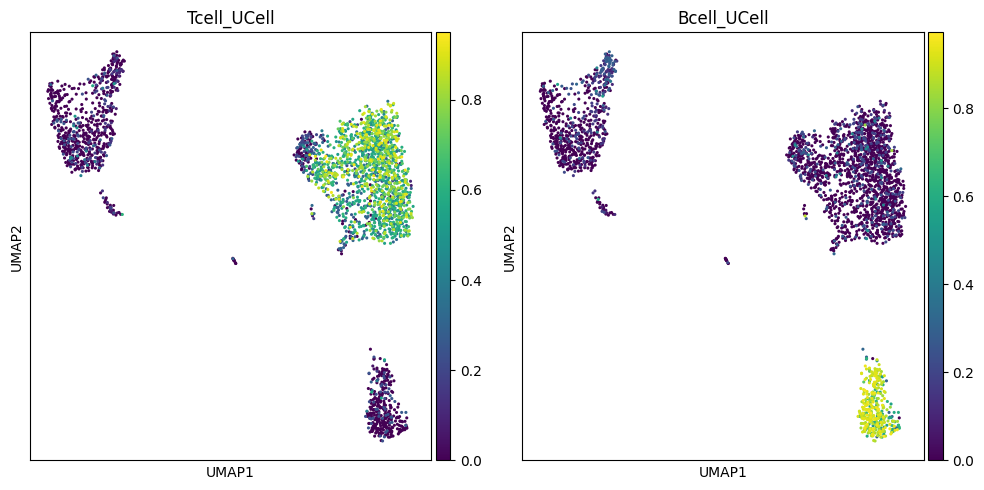
Visualize results on UMAP#
# Normalize total counts per cell
sc.pp.normalize_total(adata, target_sum=1e4)
# Log1p transform
sc.pp.log1p(adata)
sc.pp.scale(adata, max_value=10)  # optional scaling before PCA
sc.tl.pca(adata, svd_solver="arpack", n_comps=50)
sc.pp.neighbors(adata)
sc.tl.umap(adata)
fig, axes = plt.subplots(1, 2, figsize=(10, 5))
sc.pl.umap(adata, color="Tcell_UCell", cmap="viridis", ax=axes[0], size=20, show=False)
sc.pl.umap(adata, color="Bcell_UCell", cmap="viridis", ax=axes[1], size=20, show=False)
plt.tight_layout()
plt.show()
Additional resources#
For more advanced use cases and a discussion of the parameters available, refer to this tutorial
An implementation of the UCell algorithm for R is available at Bioconductor and on GitHub.
References#
If you used UCell in your research, please cite:
UCell and pyUCell: single-cell gene signature scoring for R and Python. Massimo Andreatta & Santiago J Carmona (2026) Bioinformatics - doi.org/10.1093/bioinformatics/btag055
UCell: robust and scalable single-cell gene signature scoring. Massimo Andreatta & Santiago J Carmona (2021) CSBJ - doi.org/10.1016/j.csbj.2021.06.043