pyUCell - some important parameters#
This document describes some important parameters of the pyUCell algorithm, and how they can be adapted depending on your dataset.
For a simple pyUCell tutorial refer to: pyUCell basics
Load example dataset#
import scanpy as sc
import pyucell as uc
adata = sc.datasets.pbmc3k()
adata.layers["counts"] = adata.X.copy()  # preserve raw counts before any preprocessing
Note: UCell scores are based on relative gene ranks within each cell. Per-cell transformations that preserve rank order — such as normalize_total and log1p — are safe to apply before scoring. However, per-gene transformations such as sc.pp.scale (z-score across cells) change within-cell gene rankings and will produce different scores.
To avoid subtle errors when the count matrix is overwritten by preprocessing steps, it is good practice to store raw counts in a layer immediately after loading:
adata.layers["counts"] = adata.X.copy()
and pass layer="counts" to compute_ucell_scores or get_rankings.
1. Positive and negative gene sets in signatures#
pyUCell supports positive and negative gene sets within a signature. Simply append + or - signs to the genes to include them in positive and negative sets, respectively. For example:
signatures = {"CD8T": ["CD8A+", "CD8B+", "CD4-"], "CD4T": ["CD4+", "CD40LG+", "CD8A-", "CD8B-"]}
pyUCell evaluates the positive and negative gene sets separately, then subtracts the scores. The parameter w_neg controls the relative weight of the negative gene set compared to the positive set (w_neg=1.0 means equal weight). Note that the combined score is clipped to zero, to preserve UCell scores in the [0, 1] range.
uc.compute_ucell_scores(adata, signatures=signatures, w_neg=1)
adata.obs
| CD8T_UCell | CD4T_UCell | |
|---|---|---|
| index | ||
| AAACATACAACCAC-1 | 0.770771 | 0.000000 |
| AAACATTGAGCTAC-1 | 0.000000 | 0.000000 |
| AAACATTGATCAGC-1 | 0.000000 | 0.252586 |
| AAACCGTGCTTCCG-1 | 0.000000 | 0.000000 |
| AAACCGTGTATGCG-1 | 0.000000 | 0.000000 |
| ... | ... | ... |
| TTTCGAACTCTCAT-1 | 0.000000 | 0.000000 |
| TTTCTACTGAGGCA-1 | 0.000000 | 0.000000 |
| TTTCTACTTCCTCG-1 | 0.000000 | 0.000000 |
| TTTGCATGAGAGGC-1 | 0.000000 | 0.000000 |
| TTTGCATGCCTCAC-1 | 0.000000 | 0.000000 |
2700 rows × 2 columns
2. The max_rank parameter#
Single-cell data are sparse. In other words, for any given cell only a few hundred/a few thousand genes (out of tens of thousands) are detected with at least one UMI count. Because UCell scores are based on ranking genes by their expression values, it is essential to account for data sparsity when calculating ranks. This is implemented by capping ranks to a max_rank parameter, in other words only the top max_rank genes are ranked, and the rest are assumed equivalent at the lowest ranking value.
It is often useful to adjust the max_rank depending on the sparsity of your dataset. A good rule of thumb is to examine the median number of expressed genes per cell, and set max_rank in that order of magnitude. For example, for the test dataset:
aa = adata.copy()
sc.pp.calculate_qc_metrics(aa, inplace=True)

sc.pl.violin(aa, "n_genes_by_counts", jitter=0.4, size=1, log=True, groupby=None)
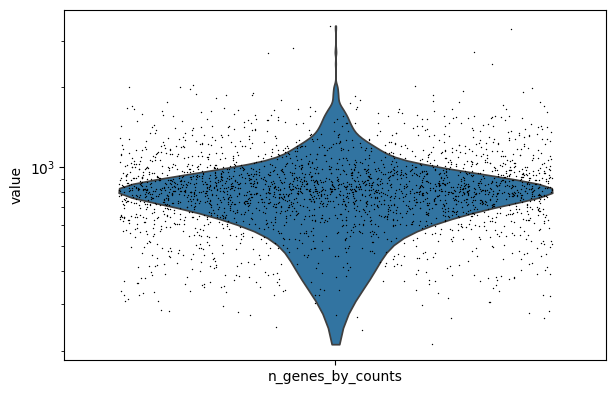
This dataset has relatively low depth, so it is advisable to choose a max_rank around 800-1000 (from the default 1500)
uc.compute_ucell_scores(adata, signatures=signatures, max_rank=800)
This is even more important when applying pyUCell to technologies/modalities of much lower dimensionality, for example probe-based spatial transcriptomics data (e.g. Xenium, CosMx), or antibody tags (ADT) in CITE-seq experiments. Xenium panels contain a few hundred/a few thousand genes; CITE-seq can detect a few hundred proteins, as opposed to thousands of genes in scRNA-seq. The max_rank parameter should then also be adjusted to reflect the new dimensionality and set to no more than the number of probes in the panel.
3. Handling missing genes#
If a subset of the genes in your signature are absent from the count matrix, how should they be handled?
pyUCell offers two alternative ways of handling missing genes:
missing_genes="impute"(default): it assumes that absence from the count matrix means zero expression. All values for this gene are imputed to zero.missing_genes="skip": simply exclude all missing genes from the signatures; they won’t contribute to the scores.
signatures = {"CD8T": ["CD8A+", "CD8B+", "CD4-", "notagene"]}
uc.compute_ucell_scores(adata, signatures=signatures, missing_genes="impute")
adata.obs
| CD4T_UCell | CD8T_UCell | |
|---|---|---|
| index | ||
| AAACATACAACCAC-1 | 0.000000 | 0.514019 |
| AAACATTGAGCTAC-1 | 0.000000 | 0.000000 |
| AAACATTGATCAGC-1 | 0.035692 | 0.000000 |
| AAACCGTGCTTCCG-1 | 0.000000 | 0.000000 |
| AAACCGTGTATGCG-1 | 0.000000 | 0.000000 |
| ... | ... | ... |
| TTTCGAACTCTCAT-1 | 0.000000 | 0.000000 |
| TTTCTACTGAGGCA-1 | 0.000000 | 0.000000 |
| TTTCTACTTCCTCG-1 | 0.000000 | 0.000000 |
| TTTGCATGAGAGGC-1 | 0.000000 | 0.000000 |
| TTTGCATGCCTCAC-1 | 0.000000 | 0.000000 |
2700 rows × 2 columns
uc.compute_ucell_scores(adata, signatures=signatures, missing_genes="skip")
adata.obs
| CD4T_UCell | CD8T_UCell | |
|---|---|---|
| index | ||
| AAACATACAACCAC-1 | 0.000000 | 0.770771 |
| AAACATTGAGCTAC-1 | 0.000000 | 0.000000 |
| AAACATTGATCAGC-1 | 0.035692 | 0.000000 |
| AAACCGTGCTTCCG-1 | 0.000000 | 0.000000 |
| AAACCGTGTATGCG-1 | 0.000000 | 0.000000 |
| ... | ... | ... |
| TTTCGAACTCTCAT-1 | 0.000000 | 0.000000 |
| TTTCTACTGAGGCA-1 | 0.000000 | 0.000000 |
| TTTCTACTTCCTCG-1 | 0.000000 | 0.000000 |
| TTTGCATGAGAGGC-1 | 0.000000 | 0.000000 |
| TTTGCATGCCTCAC-1 | 0.000000 | 0.000000 |
2700 rows × 2 columns
4. Chunk size#
UCell scores are calculated individually for each cell (though they may be later smoothed by nearest-neighbor similarity). This means that computation can be easily split into batches, reducing the computational footprint of gene ranking and enabling parallel processing (see below). The size of the batches is controlled by the chunk_size parameter. Large chunks take up more RAM, while small chunk sizes have large overhead from dataset splitting and merging. A sweet spot for chunk_size is usually in the order of 100-1000 cells per batch.
uc.compute_ucell_scores(adata, signatures=signatures, chunk_size=100)
5. Parallelization#
Parallelization is handled internally by joblib and the Parallel module. You may control the number of jobs with the n_jobs parameter. By default all available cores are used (n_jobs=-1).
%time uc.compute_ucell_scores(adata, signatures=signatures, n_jobs=1)
CPU times: user 1.45 s, sys: 31.4 ms, total: 1.48 s
Wall time: 1.48 s
%time uc.compute_ucell_scores(adata, signatures=signatures, n_jobs=4)
CPU times: user 97.8 ms, sys: 112 ms, total: 210 ms
Wall time: 4.61 s
6. Calculating UCell scores from pre-computed ranks#
Sometimes one may want to explore multiple variants of gene signatures and test them iteratively. Calling compute_ucell_scores repeatedly for new signatures requires recomputing gene ranks from scratch each time. You can avoid this by pre-computing the rank matrix once with get_rankings() and then scoring each signature set with compute_scores_from_ranks(). The rank matrix can also be saved and reloaded for later reuse.
Memory note: this approach keeps the full rank matrix in memory (a sparse matrix of shape
n_genes × n_cells). For large datasets this can be substantial — make sure you have enough RAM before pre-computing ranks.
signatures_a = {"Tcell": ["CD3D", "CD3E", "CD2"], "Bcell": ["MS4A1", "CD79A", "CD79B"]}
signatures_b = {"CD8T": ["CD8A", "CD8B"], "CD4T": ["CD4", "CD40LG"]}

# Compute ranks once from raw counts — reuse for both signature sets
ranks = uc.get_rankings(adata, layer="counts")

uc.compute_scores_from_ranks(adata, ranks, signatures=signatures_a)
uc.compute_scores_from_ranks(adata, ranks, signatures=signatures_b)

adata.obs[["Tcell_UCell", "Bcell_UCell", "CD8T_UCell", "CD4T_UCell"]]
| Tcell_UCell | Bcell_UCell | CD8T_UCell | CD4T_UCell | |
|---|---|---|---|---|
| index | ||||
| AAACATACAACCAC-1 | 0.599688 | 0.000000 | 0.770771 | 0.000000 |
| AAACATTGAGCTAC-1 | 0.000000 | 0.856030 | 0.000000 | 0.000000 |
| AAACATTGATCAGC-1 | 0.902982 | 0.000000 | 0.000000 | 0.252586 |
| AAACCGTGCTTCCG-1 | 0.191366 | 0.000000 | 0.000000 | 0.000000 |
| AAACCGTGTATGCG-1 | 0.000000 | 0.000000 | 0.000000 | 0.000000 |
| ... | ... | ... | ... | ... |
| TTTCGAACTCTCAT-1 | 0.000000 | 0.000000 | 0.000000 | 0.000000 |
| TTTCTACTGAGGCA-1 | 0.000000 | 0.626391 | 0.000000 | 0.000000 |
| TTTCTACTTCCTCG-1 | 0.000000 | 0.802403 | 0.000000 | 0.000000 |
| TTTGCATGAGAGGC-1 | 0.000000 | 0.650645 | 0.000000 | 0.000000 |
| TTTGCATGCCTCAC-1 | 0.594571 | 0.000000 | 0.000000 | 0.000000 |
2700 rows × 4 columns
7. GPU acceleration#
By default pyUCell uses the CPU path with joblib parallelism. If you have a CUDA (NVIDIA) or MPS (Apple Silicon) GPU available, you can accelerate both rank computation and kNN smoothing by installing the optional GPU extra and passing a device argument:
pip install pyucell[gpu] # installs torch
The device options are:
|
Effect |
|---|---|
|
CPU path via joblib — no torch required |
|
Uses CUDA if available, then MPS, then falls back to CPU |
|
NVIDIA GPU (raises an error if CUDA is unavailable) |
|
Apple Silicon GPU (raises an error if MPS is unavailable) |
Note: the torch backend only supports
ties_method="min"or"ordinal". The default"average"ties method is CPU-only. For most datasets the difference in scores is negligible.
signatures = {"Tcell": ["CD3D", "CD3E", "CD2"], "Bcell": ["MS4A1", "CD79A", "CD79B"]}

# device="auto" selects the best available hardware;
# falls back to CPU torch if no GPU is found.
uc.compute_ucell_scores(adata, signatures=signatures, device="auto", ties_method="ordinal")
adata.obs[["Tcell_UCell", "Bcell_UCell"]]
| Tcell_UCell | Bcell_UCell | |
|---|---|---|
| index | ||
| AAACATACAACCAC-1 | 0.597686 | 0.000000 |
| AAACATTGAGCTAC-1 | 0.000000 | 0.840009 |
| AAACATTGATCAGC-1 | 0.901869 | 0.000000 |
| AAACCGTGCTTCCG-1 | 0.255674 | 0.000000 |
| AAACCGTGTATGCG-1 | 0.000000 | 0.000000 |
| ... | ... | ... |
| TTTCGAACTCTCAT-1 | 0.000000 | 0.000000 |
| TTTCTACTGAGGCA-1 | 0.000000 | 0.556297 |
| TTTCTACTTCCTCG-1 | 0.000000 | 0.761237 |
| TTTGCATGAGAGGC-1 | 0.000000 | 0.651313 |
| TTTGCATGCCTCAC-1 | 0.590788 | 0.000000 |
2700 rows × 2 columns
References#
If you used UCell in your research, please cite:
UCell and pyUCell: single-cell gene signature scoring for R and Python. Massimo Andreatta & Santiago J Carmona (2026) Bioinformatics - doi.org/10.1093/bioinformatics/btag055
UCell: robust and scalable single-cell gene signature scoring. Massimo Andreatta & Santiago J Carmona (2021) CSBJ - doi.org/10.1016/j.csbj.2021.06.043