Signature smoothing by kNN#
Single-cell data are sparse, and gene expression is often not uniformly detected, even in cell types where specific markers should be present. Multi-gene signatures are already a lot more robust than relying on individual genes for phenotype characterization. However, they can still be impacted by data sparsity - especially short signatures composed of relatively few genes.
To mitigate sparsity, we can smooth signature scores across nearest neighbors in some relevant transcriptional space (e.g. PCA space or directly in gene expression space). pyUCell implements k-nearest neighbor (kNN) smoothing on the UCell scores stored in adata.obs, and returns smoothed scores that are less impacted by data sparsity. Below is a small example.
Prepare data and signatures#
import scanpy as sc
import matplotlib.pyplot as plt
import pyucell as uc
To run pyUCell, you will need two things: 1. a single-cell data object in AnnData format, and 2. a list of gene signatures.
First, load a test dataset:
adata = sc.datasets.pbmc3k()
We will also calculate a PCA reduction of the expression data, which will be used for nearest-neighbor smoothing.
sc.pp.normalize_total(adata, target_sum=1e4)
sc.pp.log1p(adata)
sc.pp.scale(adata, max_value=10)
sc.tl.pca(adata, svd_solver="arpack", n_comps=50)
Define two simple signatures to test
signatures = {"Bcell": ["CD19", "MS4A1", "CD79A"], "Myeloid": ["LYZ", "SPI1"]}
Run pyUCell#
First we calculate UCell scores for these gene signatures:
uc.compute_ucell_scores(adata, signatures=signatures, chunk_size=500)
kNN smoothing#
We can then smooth scores using for example the 10 nearest neighbors in PCA space:
uc.smooth_knn_scores(adata, k=10, use_rep="X_pca", obs_columns=["Bcell_UCell", "Myeloid_UCell"], suffix="_kNN")
adata.obs
| Bcell_UCell | Myeloid_UCell | Myeloid_UCell_kNN | Bcell_UCell_kNN | |
|---|---|---|---|---|
| index | ||||
| AAACATACAACCAC-1 | 0.000000 | 0.000000 | 0.101080 | 0.020556 |
| AAACATTGAGCTAC-1 | 0.421006 | 0.233567 | 0.074687 | 0.513137 |
| AAACATTGATCAGC-1 | 0.000000 | 0.150150 | 0.069996 | 0.011671 |
| AAACCGTGCTTCCG-1 | 0.000000 | 0.591258 | 0.577401 | 0.023835 |
| AAACCGTGTATGCG-1 | 0.000000 | 0.000000 | 0.049323 | 0.000000 |
| ... | ... | ... | ... | ... |
| TTTCGAACTCTCAT-1 | 0.000000 | 0.604938 | 0.581622 | 0.014074 |
| TTTCTACTGAGGCA-1 | 0.401202 | 0.000000 | 0.023058 | 0.392815 |
| TTTCTACTTCCTCG-1 | 0.536271 | 0.000000 | 0.114894 | 0.578955 |
| TTTGCATGAGAGGC-1 | 0.923676 | 0.000000 | 0.108258 | 0.517280 |
| TTTGCATGCCTCAC-1 | 0.000000 | 0.000000 | 0.085377 | 0.003931 |
2700 rows × 4 columns
Visualize results on UMAP#
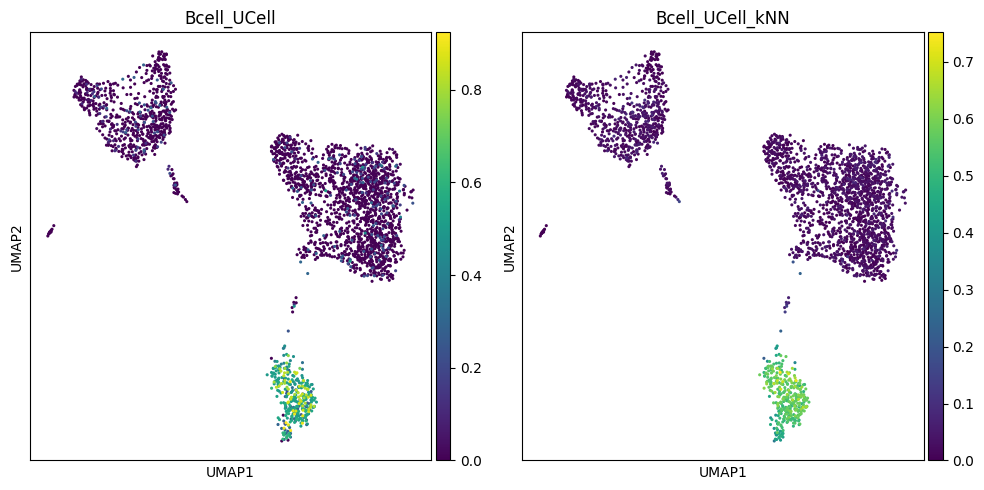
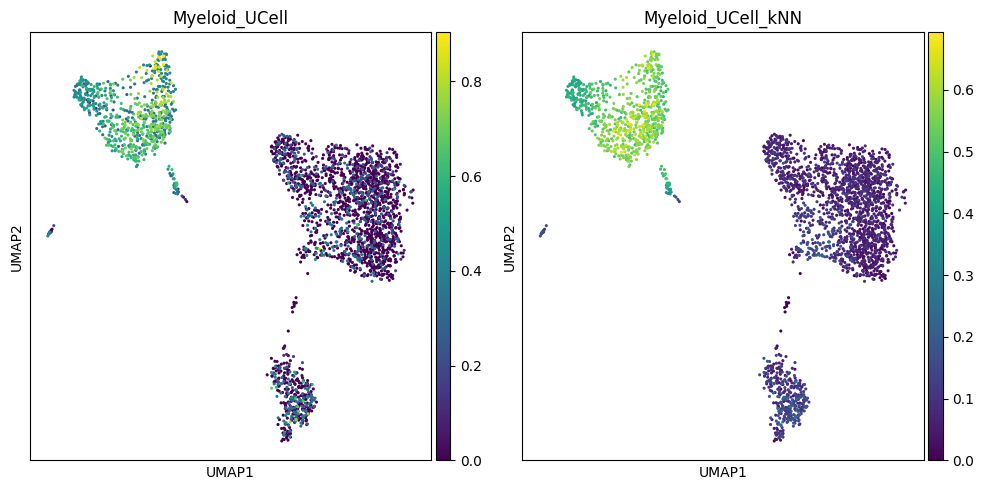
Let us visually compare the effect of kNN smoothing on the distribution of UCell scores for the two signatures.
sc.pp.neighbors(adata)
sc.tl.umap(adata)
fig, axes = plt.subplots(1, 2, figsize=(10, 5))
sc.pl.umap(adata, color="Bcell_UCell", cmap="viridis", ax=axes[0], size=20, show=False)
sc.pl.umap(adata, color="Bcell_UCell_kNN", cmap="viridis", ax=axes[1], size=20, show=False)
plt.tight_layout()
plt.show()
fig, axes = plt.subplots(1, 2, figsize=(10, 5))
sc.pl.umap(adata, color="Myeloid_UCell", cmap="viridis", ax=axes[0], size=20, show=False)
sc.pl.umap(adata, color="Myeloid_UCell_kNN", cmap="viridis", ax=axes[1], size=20, show=False)
plt.tight_layout()
plt.show()
Additional resources#
For more advanced use cases and a discussion of the parameters available, refer to this tutorial
An implementation of the UCell algorithm for R is available at Bioconductor and on GitHub.
References#
If you used UCell in your research, please cite:
UCell and pyUCell: single-cell gene signature scoring for R and Python. Massimo Andreatta & Santiago J Carmona (2026) Bioinformatics - doi.org/10.1093/bioinformatics/btag055
UCell: robust and scalable single-cell gene signature scoring. Massimo Andreatta & Santiago J Carmona (2021) CSBJ - doi.org/10.1016/j.csbj.2021.06.043